
Same Model, Different API: Benchmarking Hosted Open-Weight Routes
One model name can hide several different services. Here is a reproducible six-axis test for route latency, reliability, compatibility and effective cost.

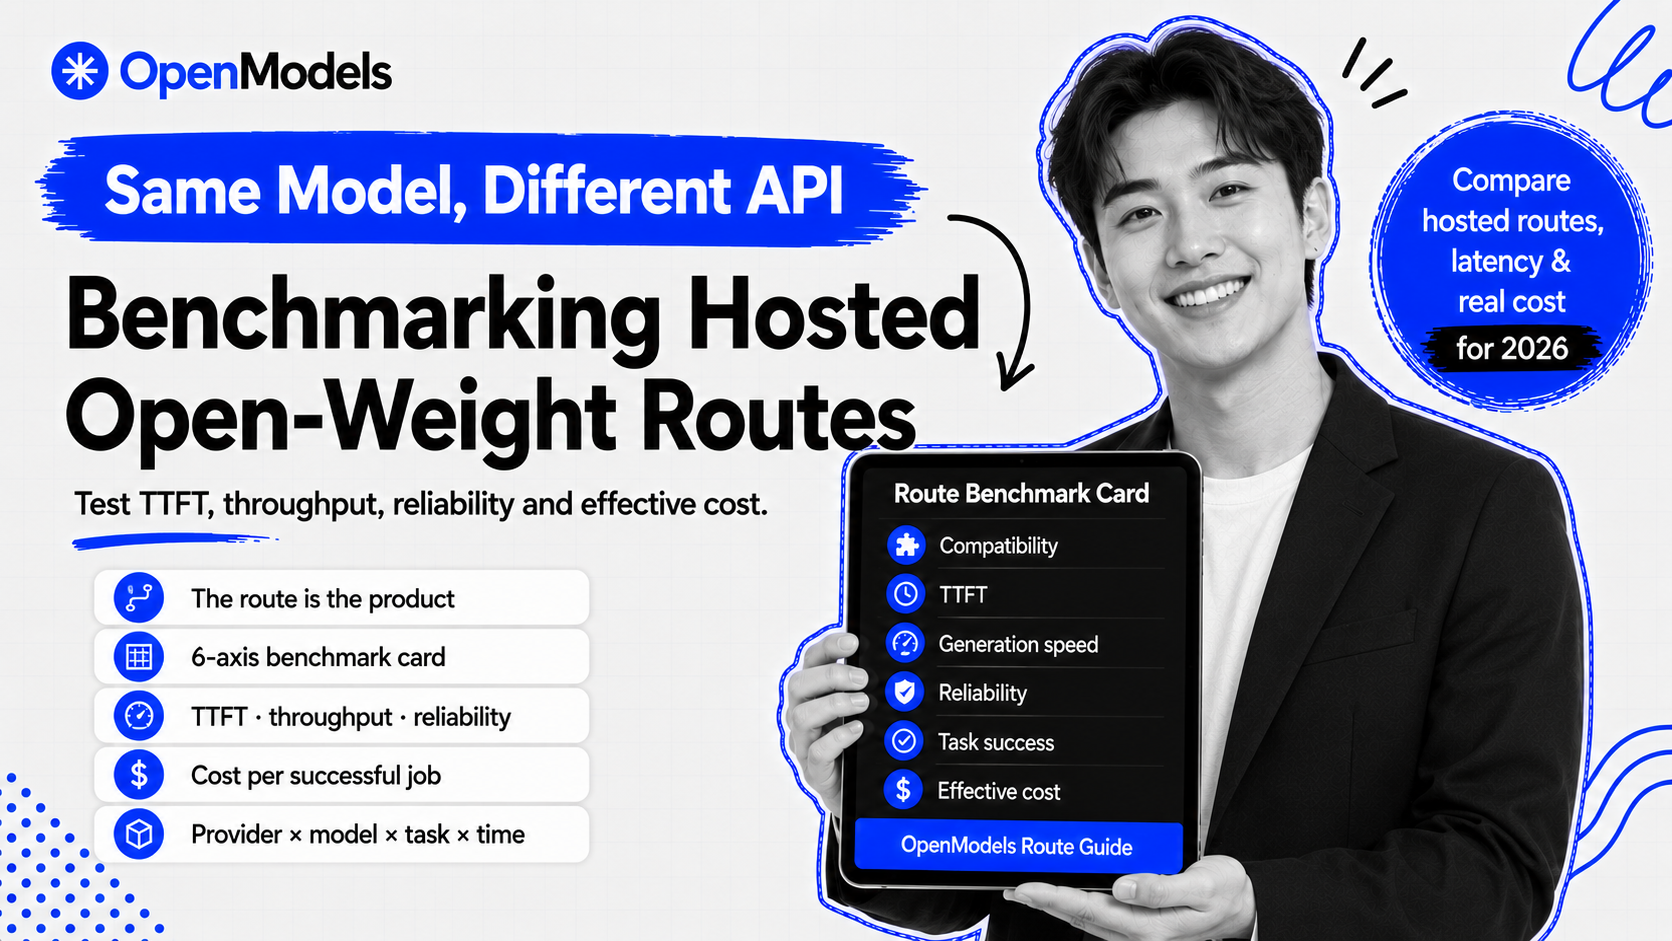
deepseek-v4 looks like one product name. In production it can describe several different services.
One endpoint may return the first token quickly and slow down during generation. Another may sustain high throughput but reject a parameter your client depends on. A third may advertise the same context window, then fail on the long prompt that made you choose the model. Prices can be close while the useful service differs.
TL;DR: Can the Same Model Perform Differently Across API Providers?
Yes. A hosted open-weight model is a model plus a provider, endpoint configuration, protocol implementation, region, capacity state and point in time. An independent 2026 measurement study found that prices for the same model were relatively anchored while latency, throughput, context capacity, protocol support and error behavior varied enough to change application outcomes. In the study's constrained routing experiments, provider selection cut Qwen3-32B cost by 37.8% and increased DeepSeek-V3.2 average throughput by about 90% compared with direct official access. Those results describe the study's Q4 2025 sample, not every provider today.
The practical unit to benchmark is not model. It is:
provider x model revision x task shape x region x time
Call that a route instance. If any term changes, rerun the test.
What "the Same Model" Actually Holds Constant
Open weights make the model artifact available. They do not force every host to serve an identical product.
A provider still chooses the inference engine, quantization, batching policy, concurrency limits, hardware, safety layer, supported request fields and deployment region. The provider can also lag behind a newly published checkpoint while continuing to expose a family-level model ID.
The 2026 paper When Is the Same Model Not the Same Service? names the operational object a provider-model-task-time tuple. Its evidence comes from sampled request logs, provider metadata, compatibility probes, pricing snapshots and continuous latency measurements collected by AI Ping during Q4 2025.
The distinction matters because model benchmarks usually answer a capability question: can these weights solve the task under the evaluation setup? A route benchmark answers an operational one: can this endpoint solve our request reliably, at the latency and cost we can accept?
A model benchmark measures weights inside a test harness. A route benchmark measures the service you can actually call.
The Six-Axis Route Benchmark Card
Comparing only price per million tokens misses most of the route.
| Axis | Measure | Why it changes the decision |
|---|---|---|
| Compatibility | accepted fields, streaming schema, tool-call validity, error shape | A nominally compatible endpoint can still break your client. |
| First-token latency | median and p95 TTFT | Interactive agents feel blocked until the first token arrives. |
| Generation speed | median and p10 output tokens/second | Long answers and code generation depend on sustained decode speed. |
| Reliability | success rate, timeout rate, 429 rate, malformed-response rate | Retries add delay and turn cheap tokens into expensive jobs. |
| Task feasibility | successful jobs divided by attempted jobs | A fast route that fails the task is not fast. |
| Effective cost | total route cost divided by successful jobs | This includes retries and unusable outputs, not only listed price. |
The paper reached the same broad conclusion from a larger measurement surface: provider listing breadth did not imply adoption, and the variables that moved most were operational rather than nominal. Its public aggregate also showed persistence. The largest family represented 32.0% of observed relative demand and the top five 87.4%, yet older versions continued to receive traffic after newer versions appeared.
That is a warning against forced migrations. A validated older route may remain the rational production choice until the new route passes the same card.
How to Run a Fair Hosted-Route Benchmark
1. Freeze the request
Use the exact same messages, temperature, output cap, tool schema and stop conditions. Record the model ID returned by the service when the response exposes one. Do not compare a reasoning-enabled request with a non-reasoning request and call the difference provider performance.
Build at least four task shapes:
- a short interactive request for TTFT;
- a long generation for sustained throughput;
- a tool call with strict JSON arguments;
- a long-context request near your real production percentile.
2. Test more than once
One request is a screenshot. Run at least 30 requests per route and task shape, spread them across several time windows. Report median and tail behavior. For user-facing traffic, p95 TTFT is often more useful than the mean because a small set of slow starts dominates the experience.
3. Stream the response
With streaming enabled, capture four timestamps: request sent, first response byte, first content token and final token. Hugging Face's official Text Generation Inference documentation uses Server-Sent Events for streaming and exposes request duration, queue time, generated tokens and mean time per token as distinct metrics. Your client-side test will not see the provider's internal queue metric, but it can observe the delay it causes.
4. Validate the output
HTTP 200 is not task success. Parse tool arguments. Check required fields. Run code or tests where safe. Compare the answer with a deterministic rubric. Mark truncated, empty and malformed responses as failures.
5. Price the successful job
Use returned token counts when available and the price of that specific route. Then include retries:
effective cost per successful job =
  total cost of all attempts / number of valid completed jobs
If a $0.20 route needs two attempts for one in ten jobs, it is not 20% cheaper than a $0.25 route with no retries.
A Minimal Reproducible Streaming Probe
This Python probe works with an OpenAI-compatible Chat Completions endpoint. It measures client-observed time to first content token and total streamed duration. Run it against each route with the same prompt and settings.
import os
import statistics
import time
from openai import OpenAI

client = OpenAI(
    base_url=os.environ["BENCH_BASE_URL"],
    api_key=os.environ["BENCH_API_KEY"],
)

def run_once(model: str) -> dict:
    started = time.perf_counter()
    first_token_at = None
    text = []

    stream = client.chat.completions.create(
        model=model,
        messages=[
            {"role": "system", "content": "Return concise, valid JSON."},
            {"role": "user", "content": "List three causes of HTTP 429 errors."},
        ],
        temperature=0,
        max_tokens=160,
        stream=True,
    )

    for chunk in stream:
        token = chunk.choices[0].delta.content or ""
        if token and first_token_at is None:
            first_token_at = time.perf_counter()
        text.append(token)

    finished = time.perf_counter()
    return {
        "ttft_s": None if first_token_at is None else first_token_at - started,
        "total_s": finished - started,
        "output": "".join(text),
    }

runs = [run_once(os.environ["BENCH_MODEL"]) for _ in range(30)]
ttft = [r["ttft_s"] for r in runs if r["ttft_s"] is not None]
print({
    "successful_streams": len(ttft),
    "median_ttft_s": statistics.median(ttft),
    "max_ttft_s": max(ttft),
})
This is a starting point, not a publication-grade harness. Add raw response capture, retry accounting, output-token counts, p95 calculation, concurrency levels, randomized route order and a task validator before publishing results. Store the UTC timestamp and region with every row.
What the Independent Study Found
The paper's two routing counterfactuals show why measurement can beat provider loyalty:
| Model | Optimization target | Reported change vs direct official access |
|---|---|---|
| Qwen3-32B | Cost under observed feasibility constraints | 37.8% lower |
| DeepSeek-V3.2 | Average throughput under observed feasibility constraints | about 90% higher |
These are not universal savings claims. The dataset is a Q4 2025 sample, the routes were measured at particular times, and the authors imposed feasibility constraints. The useful finding is structural: when providers differ, routing has something measurable to exploit.
The paper also found listed price to be more stable than latency, throughput, context length, protocol behavior and error semantics. That makes a price table necessary but insufficient. Two routes separated by five percent on price can be separated by far more on timeouts or usable throughput.
How OpenModels Fits
OpenModels exposes multiple provider routes through one OpenAI-compatible API. The standard marketplace snapshot dated 2026-07-11 contains 427 models, 503 live routes and 15 providers. Model detail pages can show per-route pricing and uptime, and supply is divided into Verified and Community routes.
The distinction needs to stay explicit. Verified routes are manually reviewed by OpenModels for pricing, data policy, reliability and authorization or compliance. Community routes are self-submitted and checked automatically; they are not manually reviewed. Both can be compared, but they do not carry the same assurance.
Marketplace metadata should shortlist routes. Your workload benchmark should choose among them.
Do not infer that every route is available for every model, or that a family-level name guarantees the latest checkpoint. Copy the exact model and route identifiers from the live listing, save the test date, and repeat the benchmark after a material model or provider change.
A Production Route Policy
Turn the benchmark card into a gate:
- Reject routes that fail required protocol fields or context length.
- Reject routes below the minimum task-success rate.
- Reject routes whose p95 TTFT breaches the product's latency budget.
- Among the remaining routes, minimize effective cost per successful job.
- Keep the runner-up as a tested fallback and recheck both on a schedule.
This policy prevents a cheap but incompatible route from winning. It also prevents a fast route from winning when it returns malformed tool calls often enough to increase total cost.
FAQ
Does the same open-weight model produce identical results across API providers?
No. Even with the same nominal weights, providers can use different revisions, quantization, inference engines, batching policies, safety layers and parameter support. Sampling also makes outputs variable. Hold request settings constant and compare distributions rather than individual answers.
Which metrics matter when comparing LLM API providers?
Measure protocol compatibility, median and p95 time to first token, sustained generation speed, task-success rate, error and timeout rates, and effective cost per successful job. Listed token price alone does not capture retries or unusable outputs.
What is time to first token?
Time to first token is the client-observed delay between sending a generation request and receiving the first generated content. It is distinct from total response time and inter-token latency. For interactive agents and chat interfaces, TTFT determines how long the product appears idle.
How many requests are needed for an LLM route benchmark?
Thirty requests per route and task shape is a reasonable screening floor, not a universal statistical guarantee. Spread runs across time windows, report medians and tail latency, and increase the sample for consequential production decisions.
Is the cheapest LLM API route always the lowest-cost route?
No. The economically relevant metric is cost per valid completed job. A low listed price can be erased by timeouts, retries, malformed tool calls or a context limit that forces extra requests.
How often should provider routes be benchmarked?
Benchmark before adoption, after model or provider changes, and on a recurring schedule that matches the workload's risk. High-volume or latency-sensitive systems should also trigger a retest when error rate, p95 TTFT or task success moves beyond a defined threshold.
Sources
- Li et al., hosted open-weight LLM API measurement study, version 3 dated 2026-05-07: cross-provider methodology, observed demand and routing counterfactuals.
- Study reproduction repository: public methodology and reproduction artifacts.
- Hugging Face Text Generation Inference metrics: request duration, queue duration, generated-token and mean-time-per-token metric definitions.
- Hugging Face streaming documentation: Server-Sent Events and OpenAI-compatible streaming examples.